 Click to enlarge
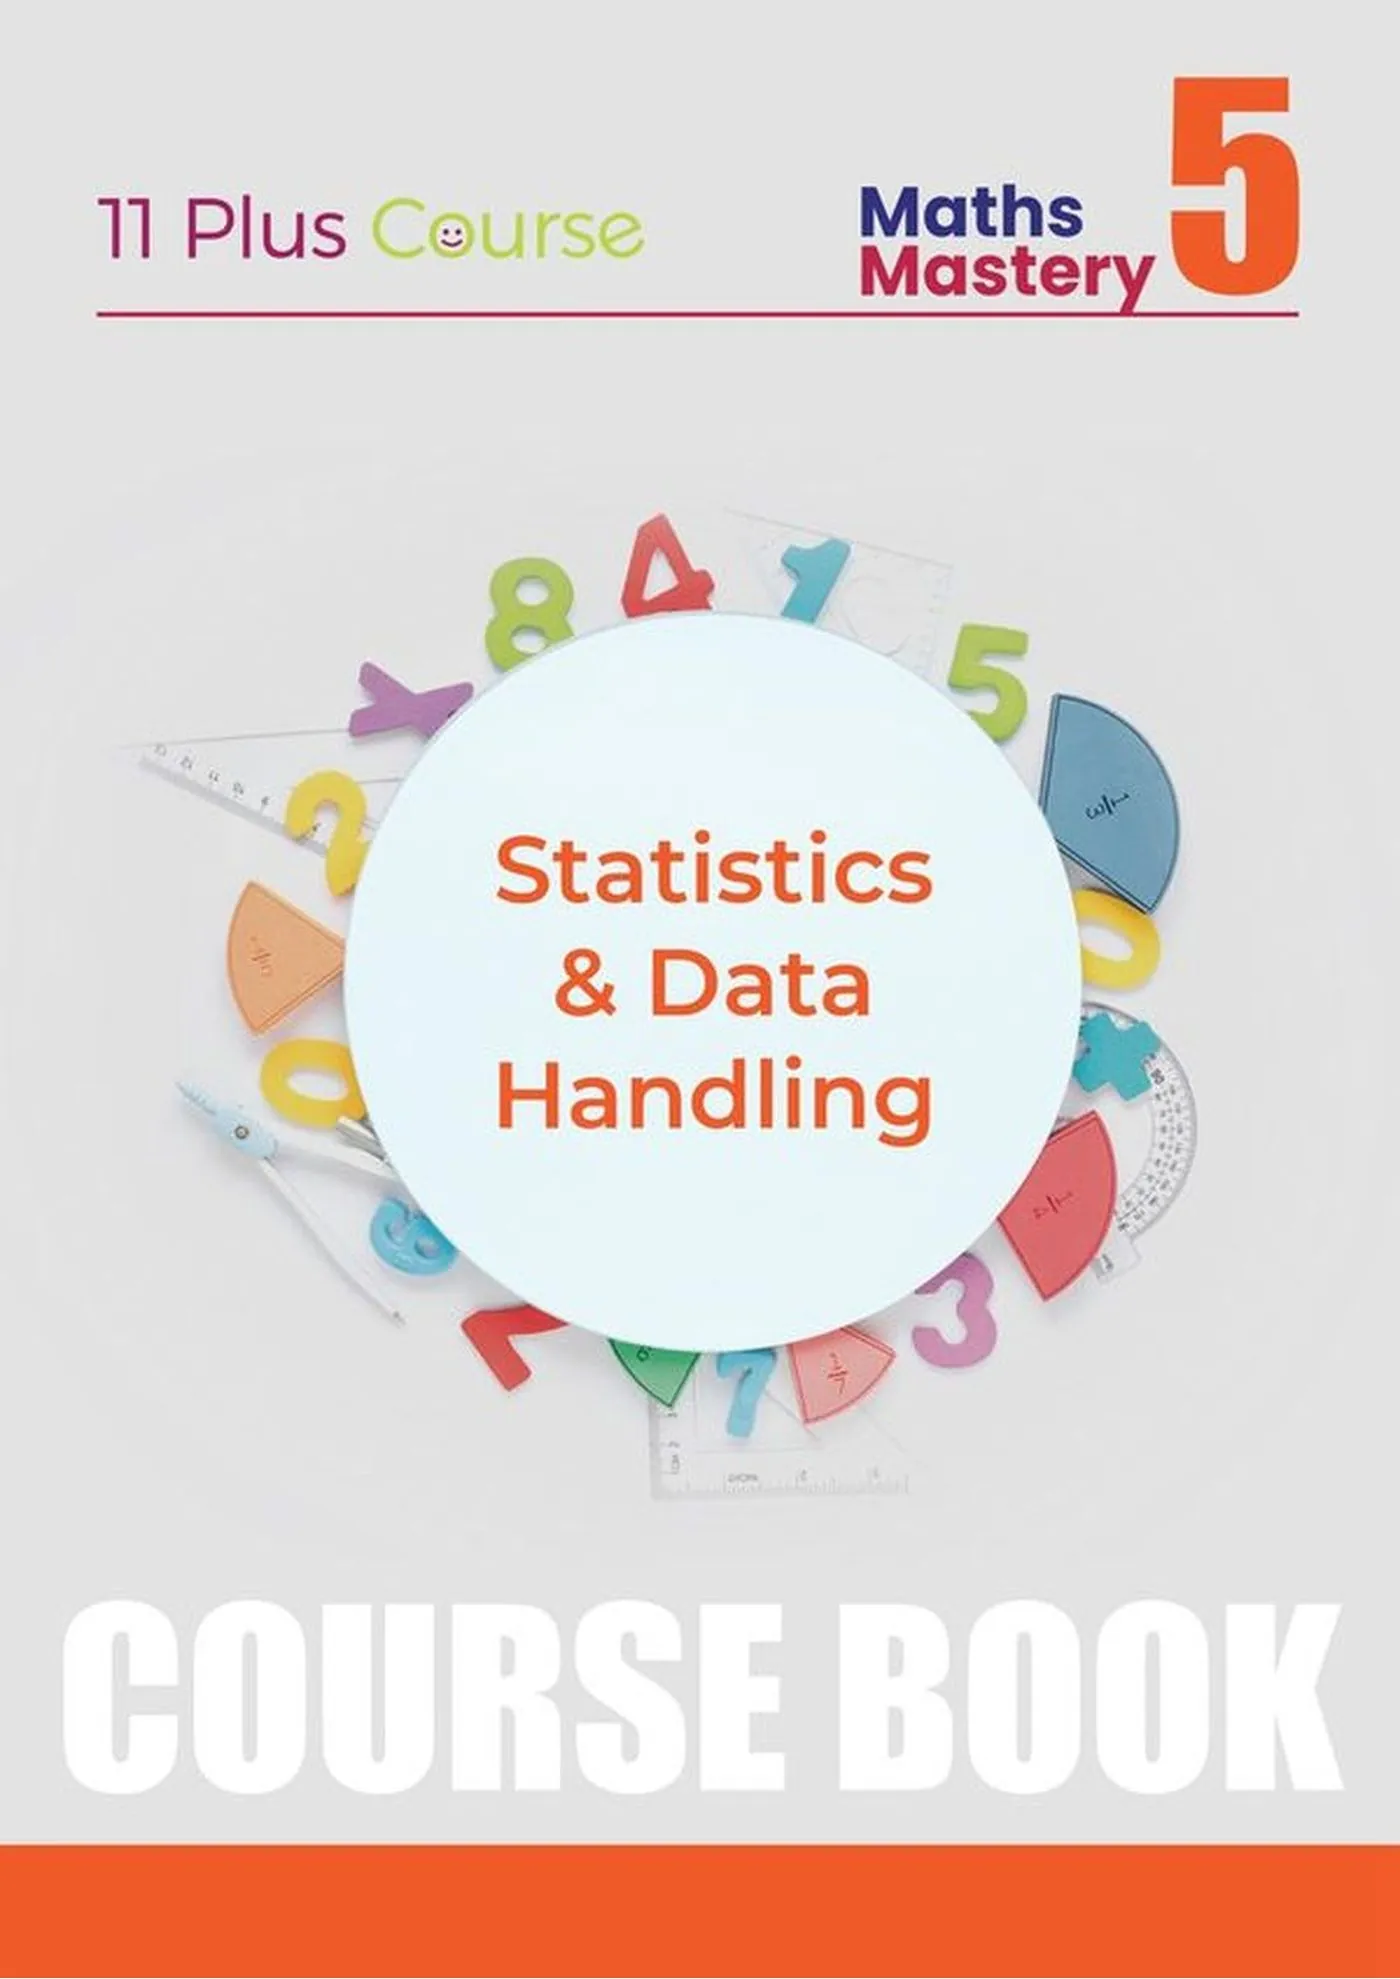
Statistics & Data Handling
Reading charts, tables and averages quickly and without errors.
- A rules page before every topic, written so a parent can teach from it
- 25 multiple-choice questions per topic, graded from accessible to scholarship level
- Full answer key
- Covers the whole 11+ syllabus across Books 1–6, then applies it in Books 7–12
Want the whole series? The full Maths series is £247, under £21 a book.
How this book is used in our course
Each topic opens with a rules page. A parent reads it with the child, then the child attempts the 25 questions unaided. Mark them, log the score, and work through every wrong answer with the key. Anything under 90% is repeated after a fortnight. The topic is only finished when the cold repeat clears 90%.
Where it sits in the series
- Previous book in the series: Book 4, Geometry: Shape, Space & Angles
- Next book in the series: Book 6, Algebra
What's inside Maths Mastery 5
Five real pages from the book, so you can see exactly what your child will work from. All 10 sample pages are in the viewer.
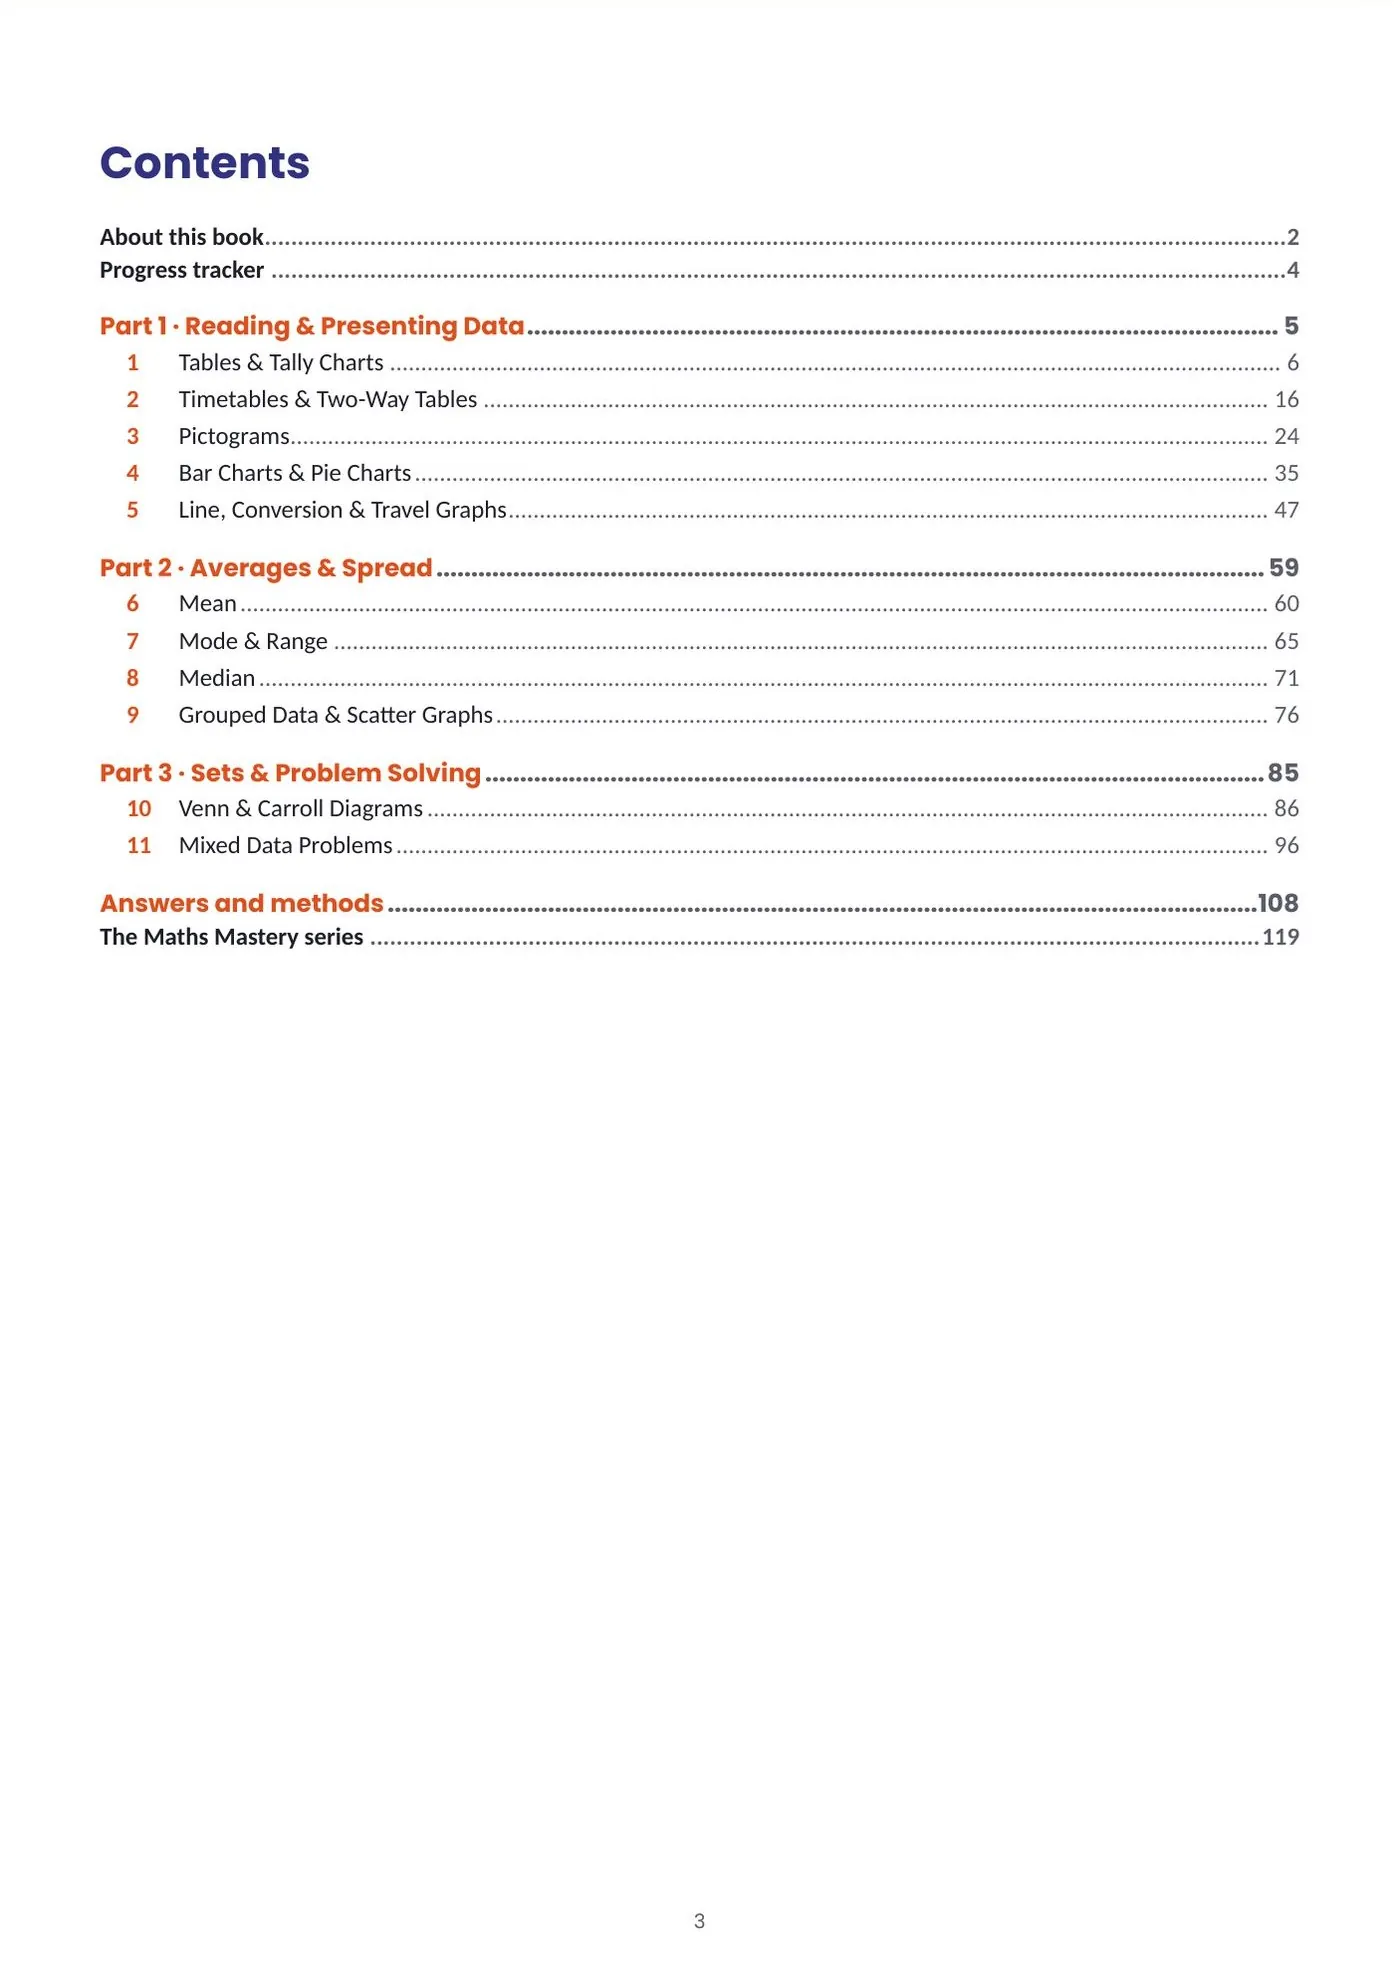
Eleven topics in three parts: every chart, table and average the papers put in front of a child.
Part 1 is reading and presenting data: tables and tally charts, timetables and two-way tables, pictograms, bar and pie charts, and line, conversion and travel graphs. Part 2 is averages and spread: mean, mode, range and median, then grouped data and scatter graphs. Part 3 is Venn and Carroll diagrams and mixed data problems, the multi-step questions that finish a paper.
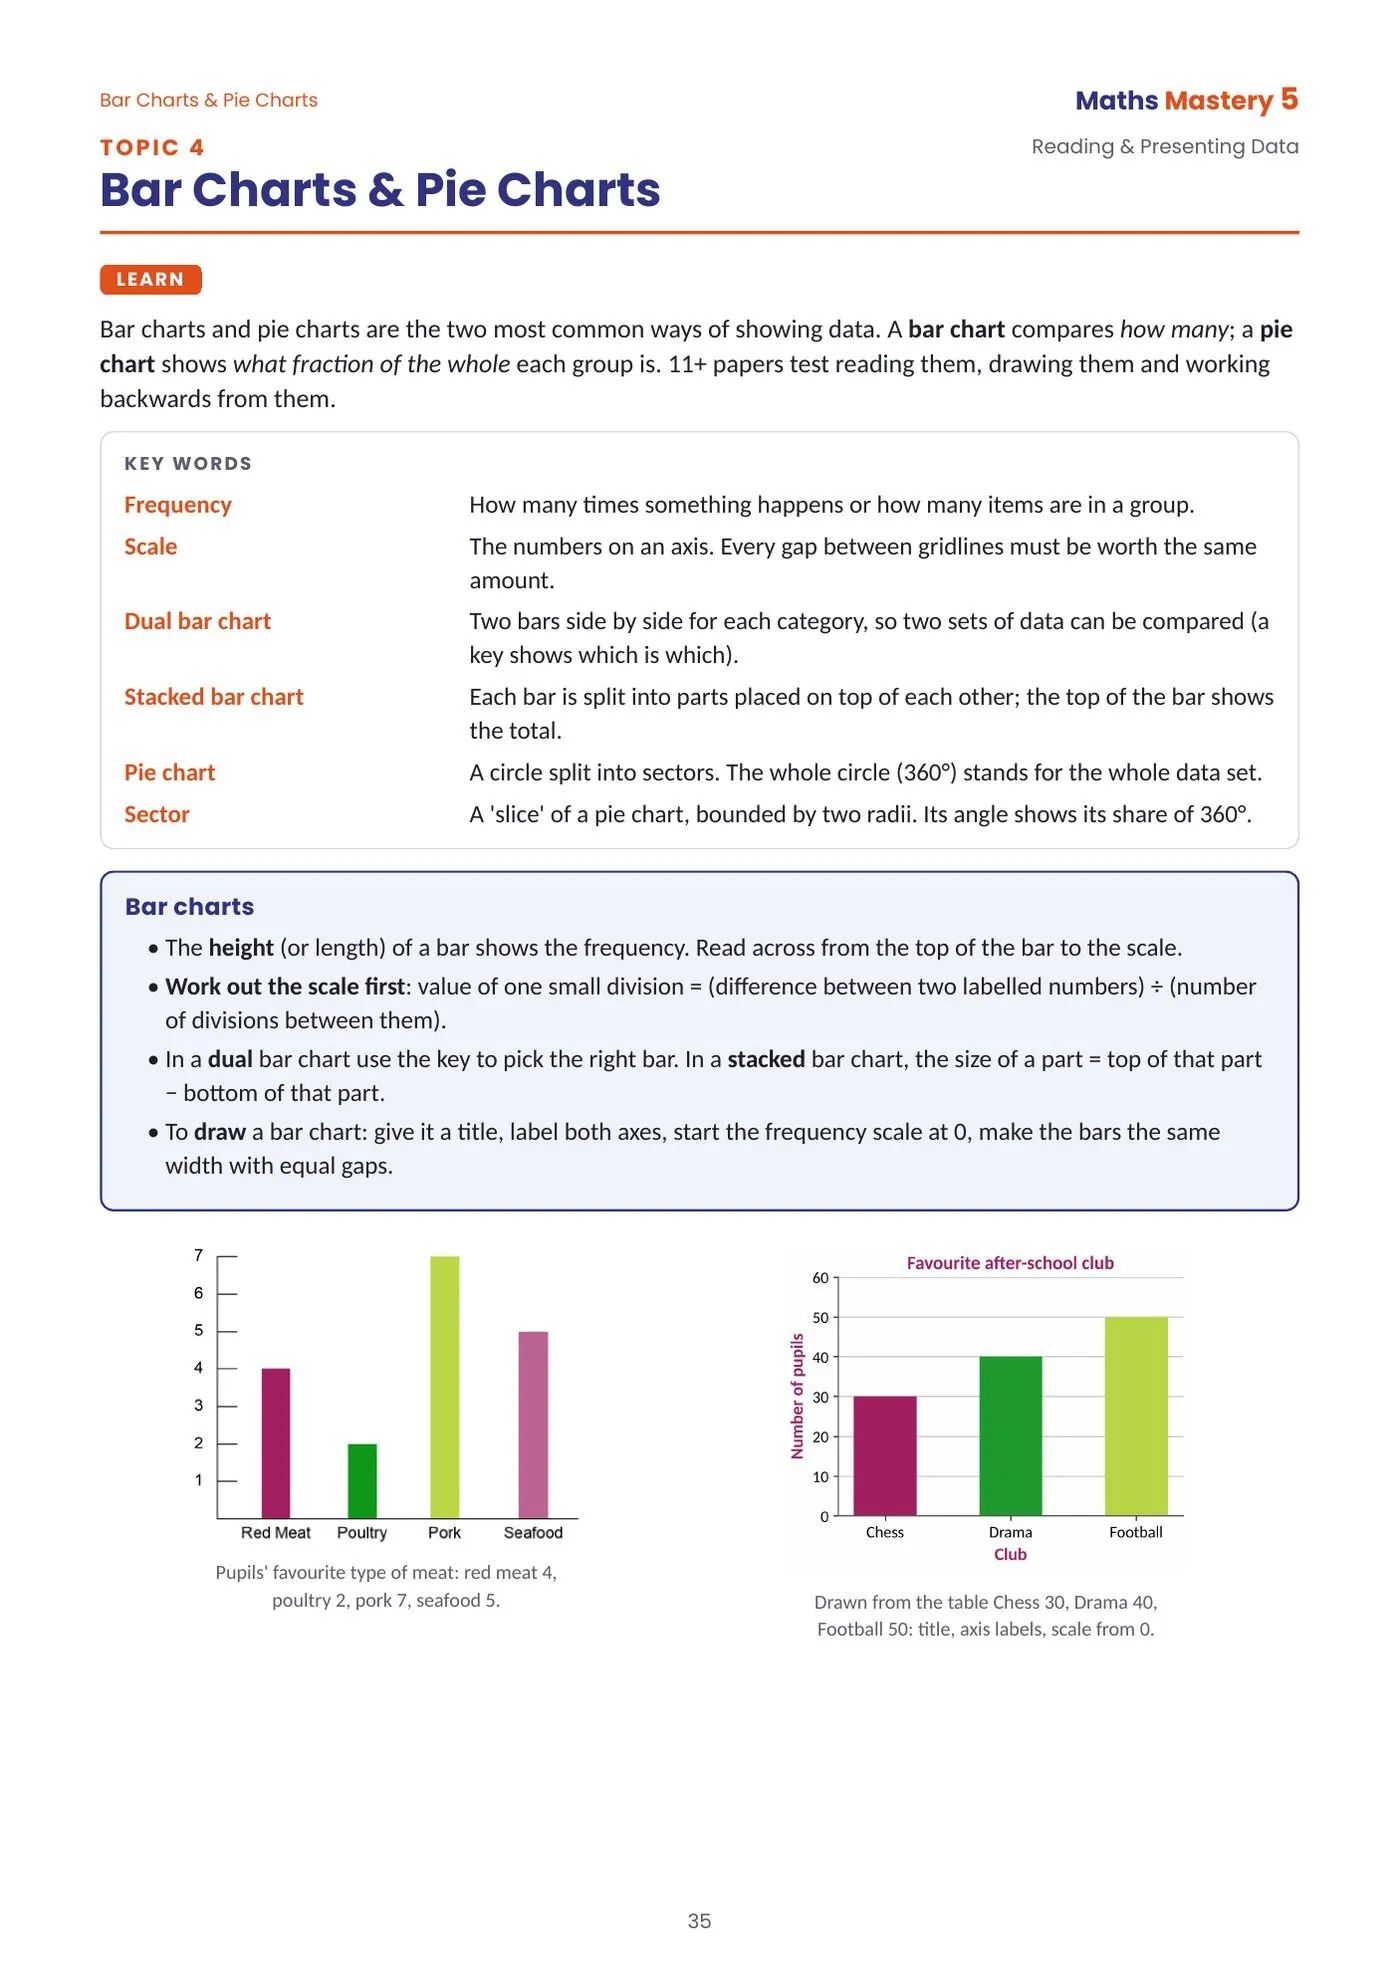
A bar chart compares how many. A pie chart shows what fraction of the whole.
The key words are the ones that lose marks: scale, dual bar chart, stacked bar chart, sector. The rule box starts with the step children skip: work out the scale first, the gap between two labelled numbers divided by the divisions between them. Then how to draw one properly: title, both axes labelled, scale from zero, because the papers ask children to draw as well as read.
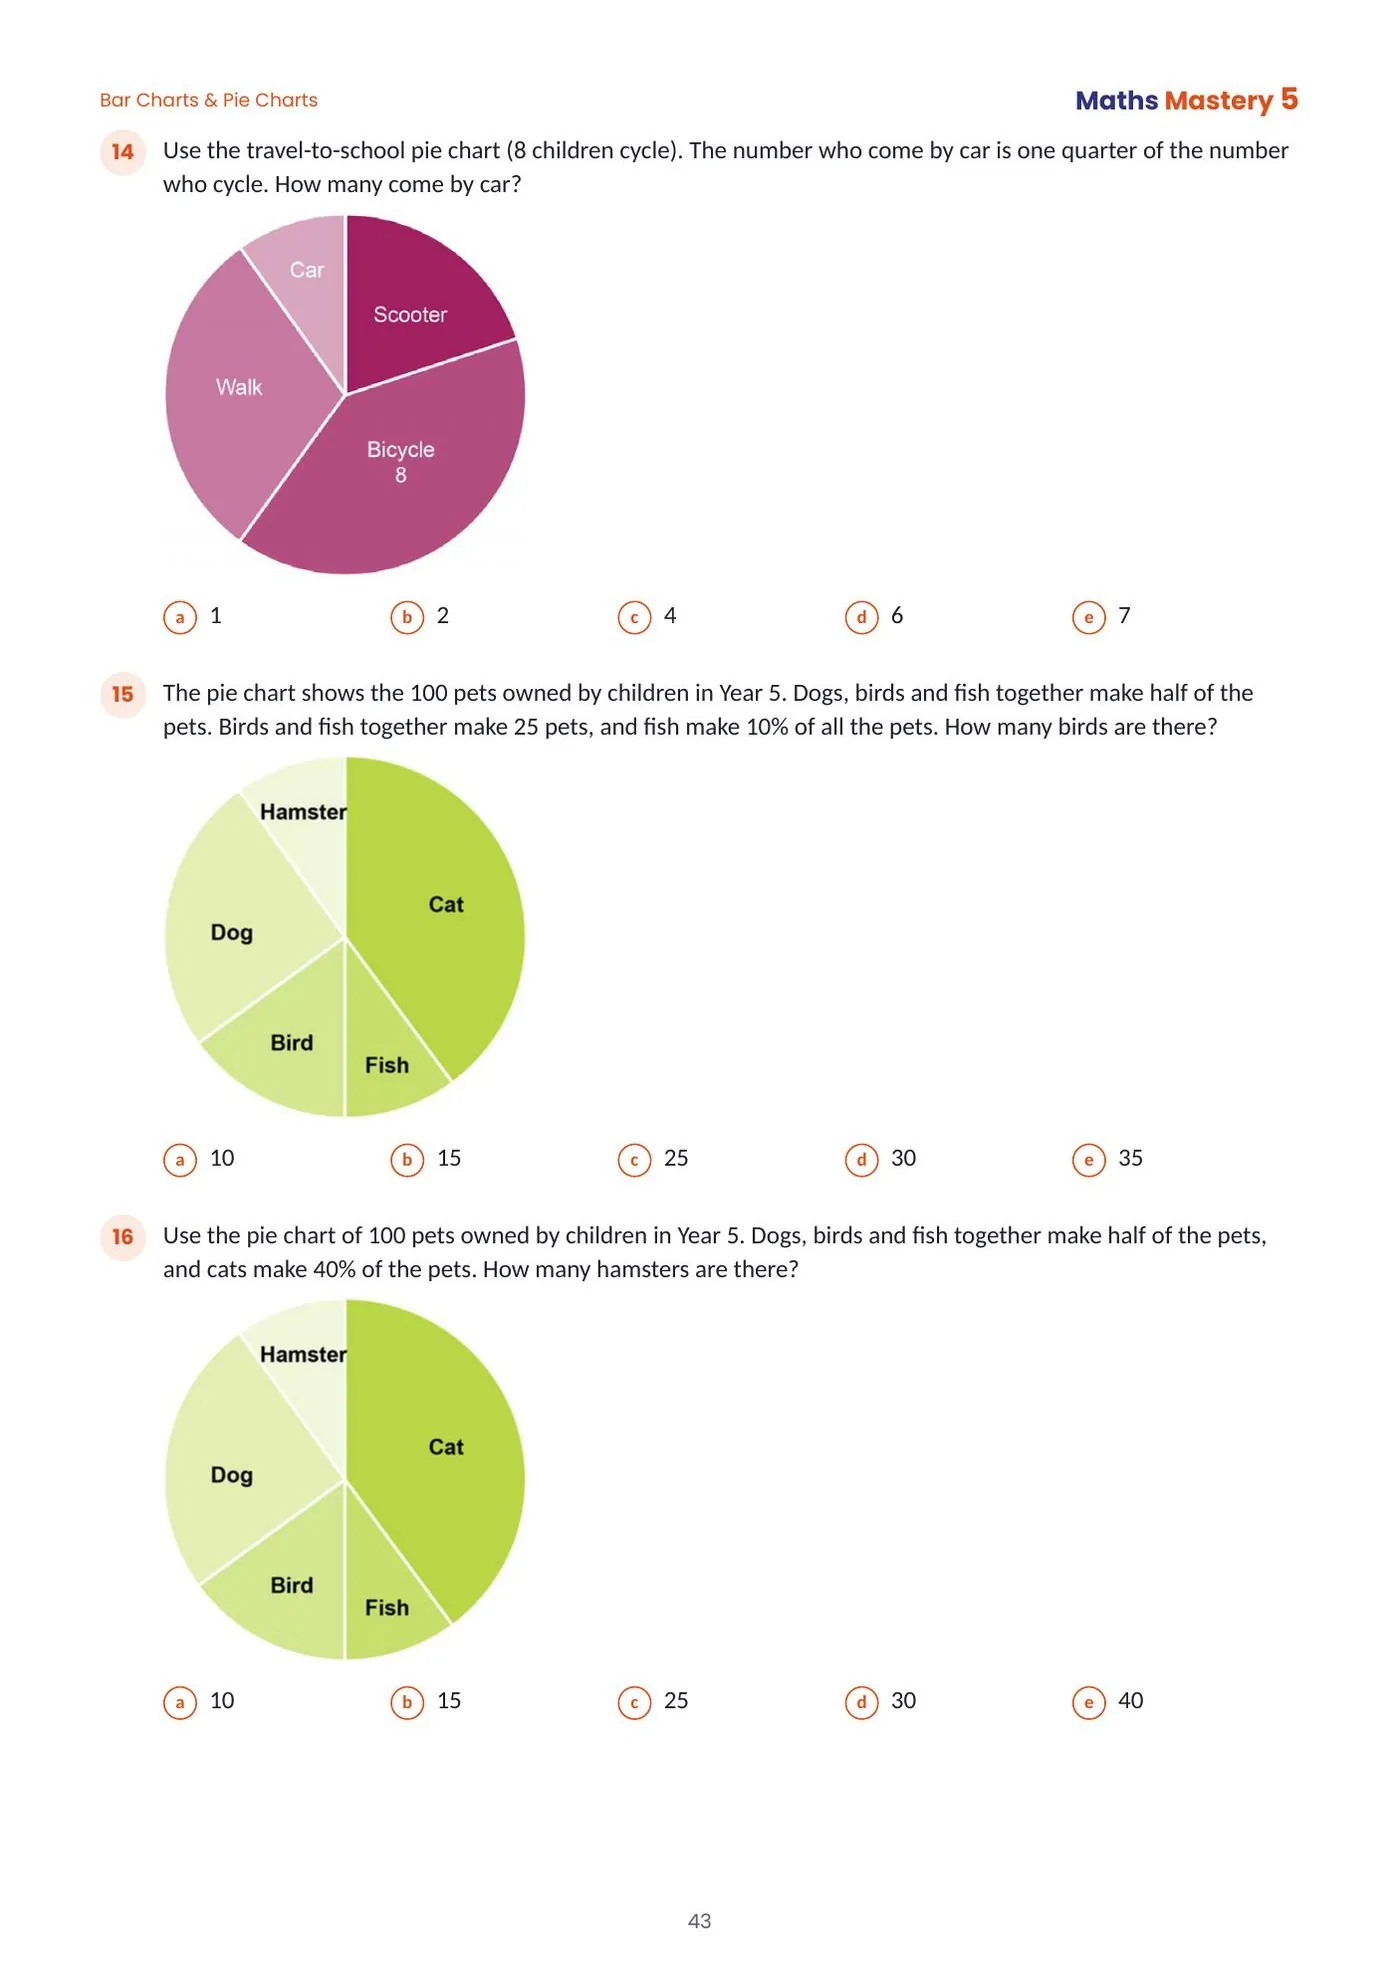
Pie charts the exam way: no angles given, work backwards from one slice.
Question 14 gives only that 8 children cycle and asks how many come by car. Questions 15 and 16 give a pie chart of 100 pets with three clues, "dogs, birds and fish together make half, fish make 10%", and ask for the birds, then the hamsters. These are reasoning questions dressed as chart questions, and they are exactly the style grammar schools use.
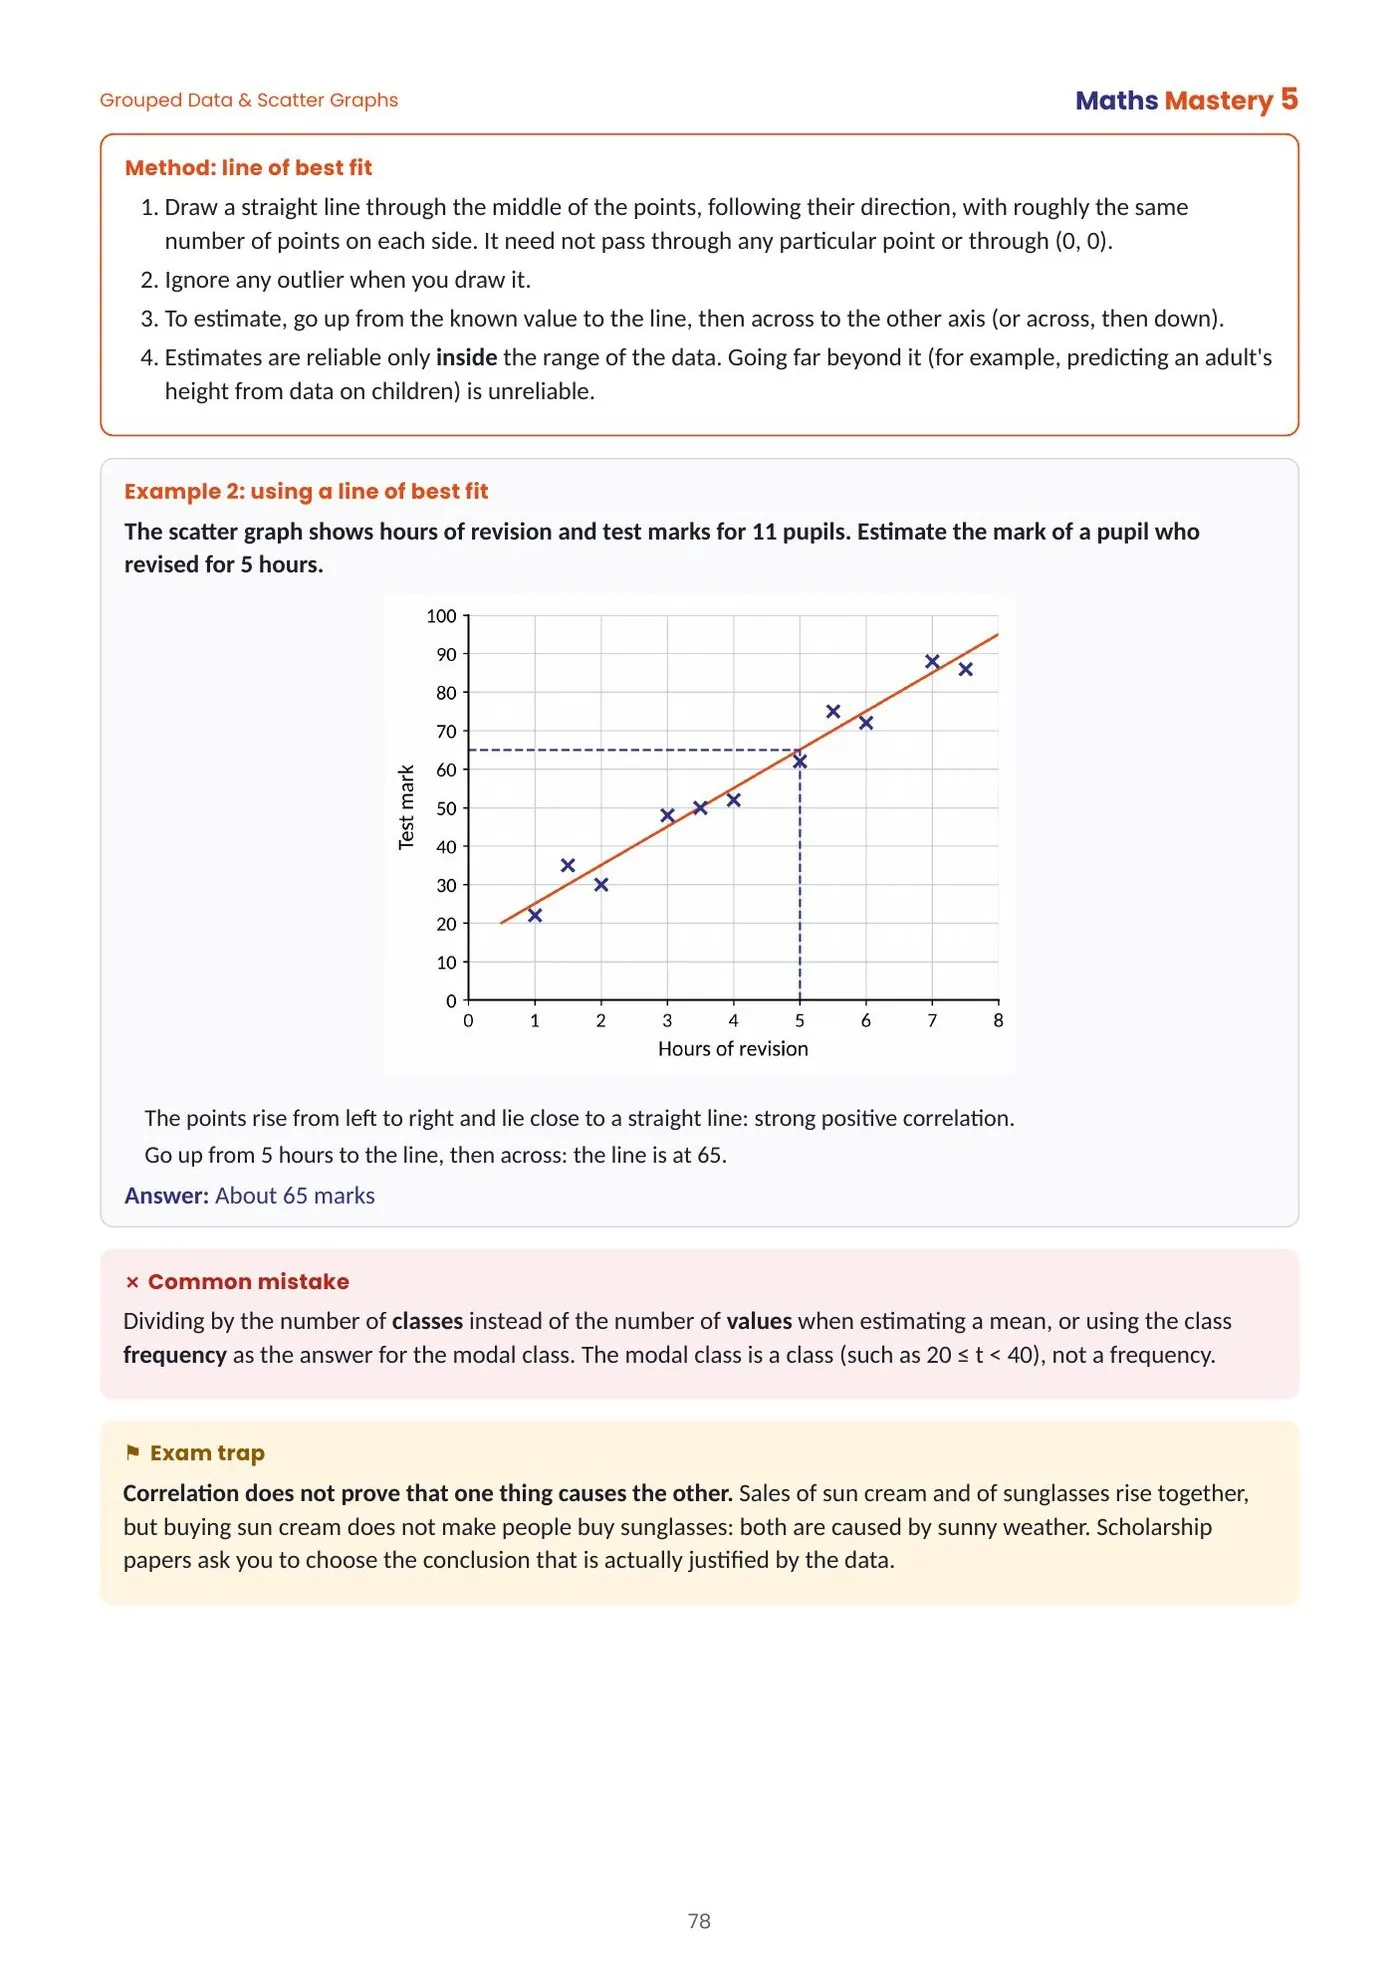
Correlation does not prove that one thing causes the other.
Line of best fit in four steps, including the one that matters at scholarship level: estimates are only reliable inside the range of the data. The Common mistake box names the two errors in grouped data: dividing by the number of classes, and giving a frequency when the question asked for the modal class. The Exam trap is the sun cream and sunglasses question, because scholarship papers ask a child to choose the conclusion the data actually justifies.
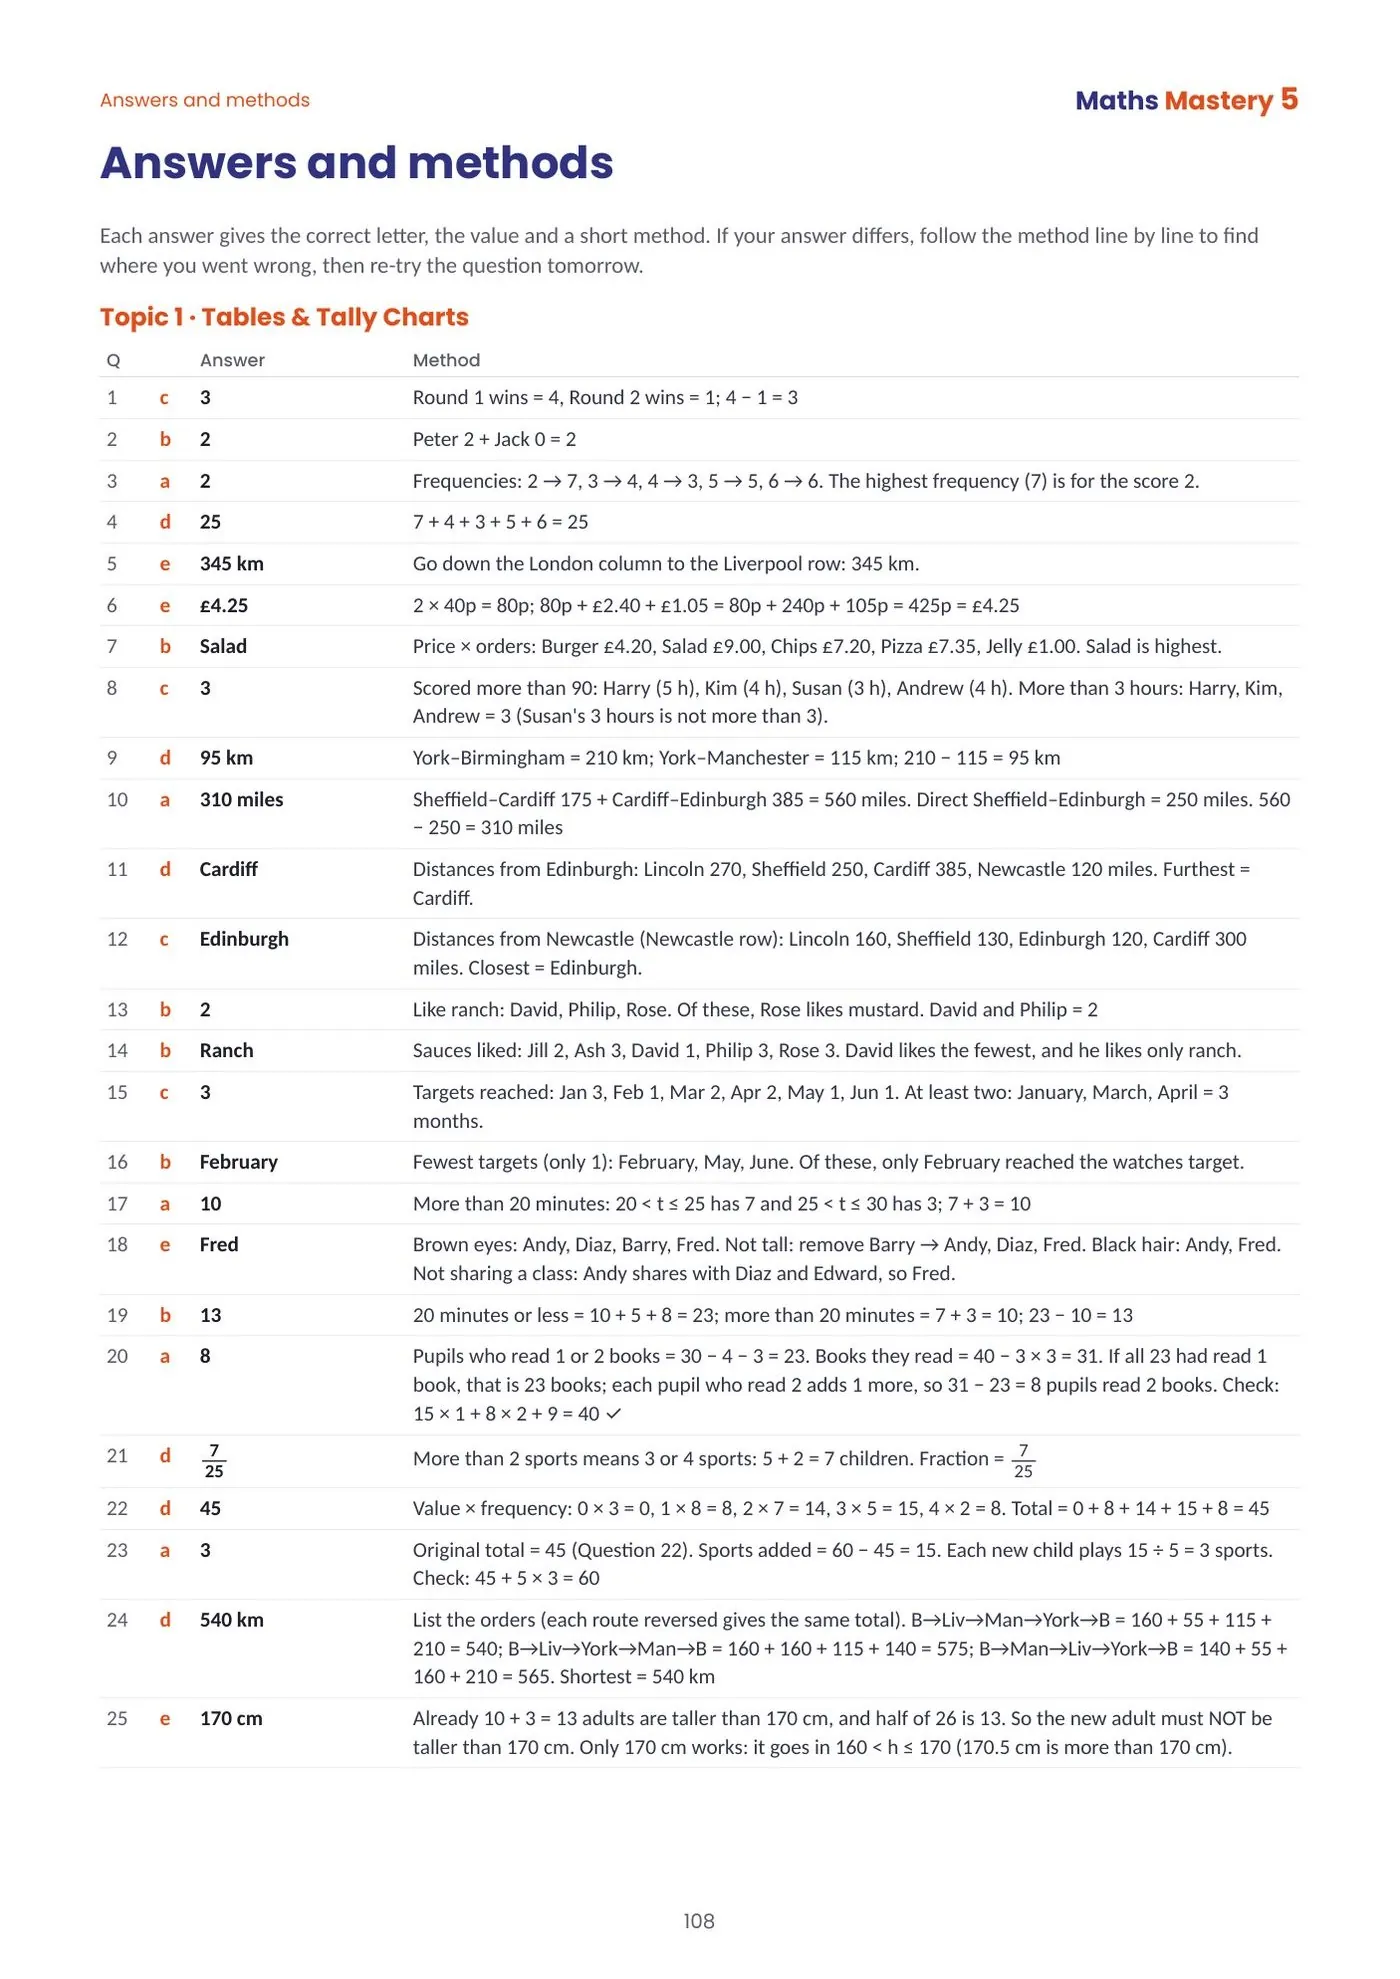
Every answer, every method, fully worked.
Question 8: "Susan’s 3 hours is not more than 3." Question 20 works a two-step puzzle through and checks it: "15 × 1 + 8 × 2 + 9 = 40 ✓". Question 25 explains why 170.5 cm fails and only 170 cm works. For data questions the method is the reading of the table, written out, so a child who got it wrong can see which column they read.
All 11 topics in the book follow the pattern shown here.
Other Year 5 books in Maths Mastery

Algebra
Letters, sequences and equations introduced the way the 11+ sets them, not the way textbooks do.

Maths Rules & Quick Tests
Every rule from Books 1–6 on one page each, with a quick test to prove it is still there.

Short Maths
One-mark questions under the clock, where exams are won or lost on care.

Long Maths
Multi-step questions with marks for method, laddered to scholarship standard.